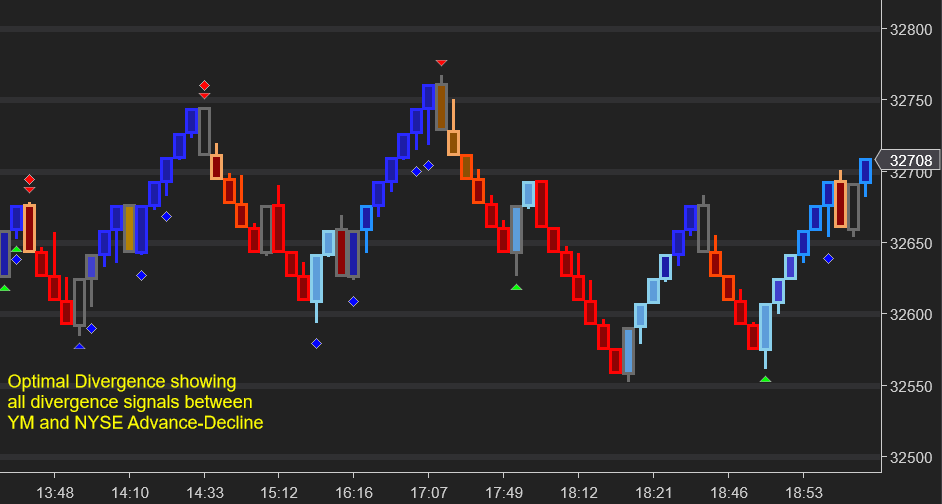
Optimal Market Breadth
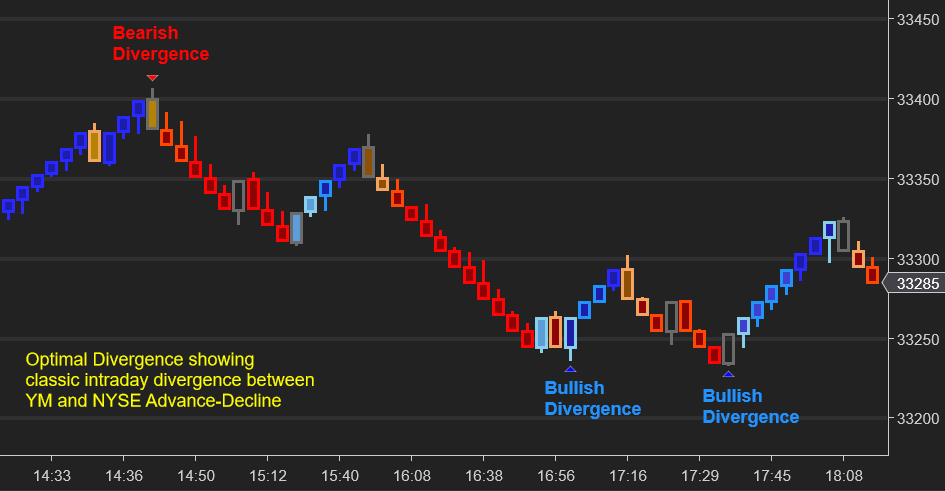
Classic Divergence

This marks when price makes a new intraday high/low but Advance-Decline does not make a new high/low. This would suggest that the move has not been supported by the wider market. This can help highlight potential turning points.
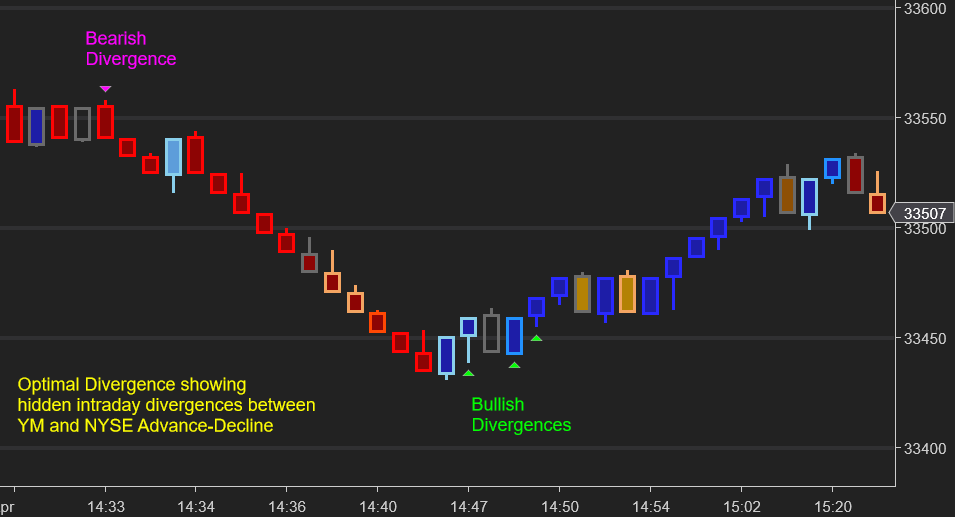
Hidden Divergence

This marks when Advance-Decline makes a new intraday high/low but price does not make a new high/low. This would suggest that extreme sentiment in the wider market has not been reflected in the futures contract, and can also flag potential turning points.

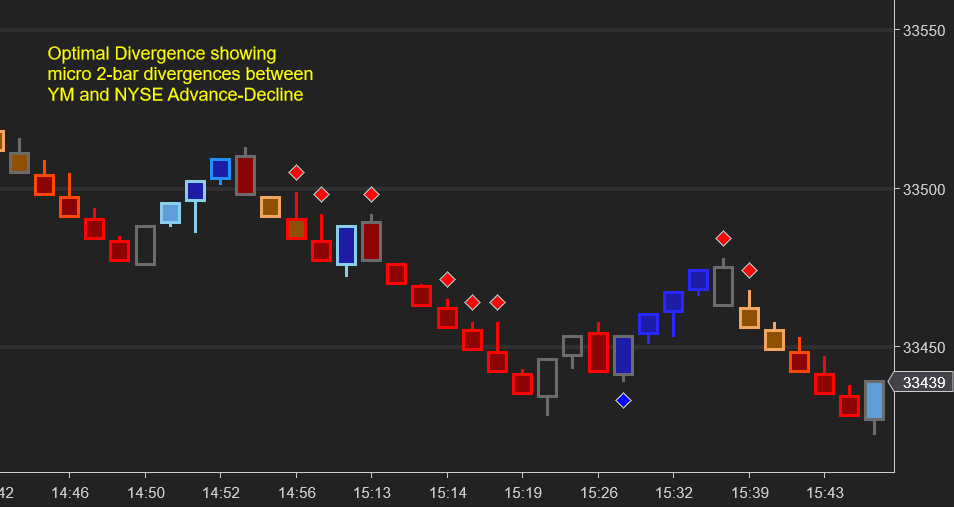
Micro Divergence

This checks for hidden and classic divergence conditions across the last two closed bars, rather than at intraday highs/lows. This can help with scalp entries and short-term inflection points.
Trading with breadth
Breadth divergences should never be a single entry condition but can provide powerful supporting evidence when viewed in context. They are most useful when the market is in intraday cycling mode and breaking/testing round number levels.


Hidden Divergence
Marks when Advance-Decline makes a new intraday high/low but price does not make a new high/low. This would suggest that extreme sentiment in the wider market has not been reflected in the futures contract, and can also flag potential turning points.
Micro Divergence
This checks for hidden and classic divergence conditions across the last two closed bars, rather than at intraday highs/lows. This can help with scalp entries and short-term inflection points.

Breadth divergences should never be a single entry condition but can provide create powerful supporting evidence when viewed in context. They are most useful when the market is in intraday cycling mode and breaking/testing round number levels.