
The Optimal System
Your digital co-pilot for navigating ES/MES markets
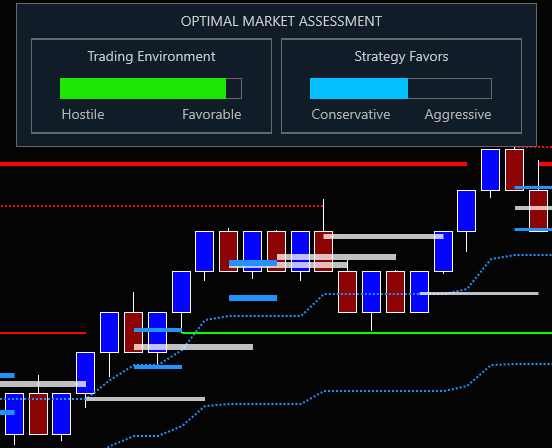
Built around eight powerful tools that assess the market, define the trend, map session structure, and pinpoint entries, Optimal System adapts to the environment to help you find the best entries and protect you from hostile markets.
Whether you're navigating volatile conditions or riding a powerful trend, it offers a logical, common-sense approach to ES and MES trading -every day.
And because it's a defined trading method, you'll receive end-of-day chart analysis straight to your inbox -so you'll quickly learn to spot set-ups on our chart template.
Inside the Optimal System
The Optimal System
Your digital co-pilot for navigating ES/MES markets
Built around eight powerful tools that assess the market, define the trend, map session structure, and pinpoint entries, Optimal System adapts to the environment to help you find the best entries and protect you from hostile markets.
Whether you're navigating volatile conditions or riding a powerful trend, it offers a logical, common-sense approach to ES and MES trading -every day.
And because it's a defined trading method, you'll receive end-of-day chart analysis straight to your inbox -so you'll quickly learn to spot set-ups on our chart template.
Inside the Optimal System
- Optimal Market Assessment
- Optimal Snap Bars
- Optimal Trendlines
- Optimal Entry
- Optimal Patterns
- Optimal Round Numbers
- Optimal Ssystem Levels
- Optimal Trend-Finder
01 Optimal Market Assessment -your on-screen trading mentor
Optimal Market Assessment
Your on-screen trading mentor
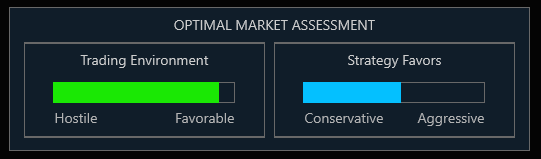
Imagine having an on-screen trading-mentor that advises you about the live market.
Optimal Market Assessment evaluates the current trading environment to determine if whether it is Favorable for discretionary traders (smoother trends, slower movement, levels respected) or Hostile (choppy, unpredictable, dominated by HFTs).
Based on this diagnosis, the on-screen meter suggests your strategic posture:
- Aggressive entries when conditions align
- Conservative entries when the market turns dangerous.
Adapt your trading strategy in real time: switch between aggressive and conservative modes as the market changes.
02 Optimal Snap Bars -renko bars that lock to a fixed grid
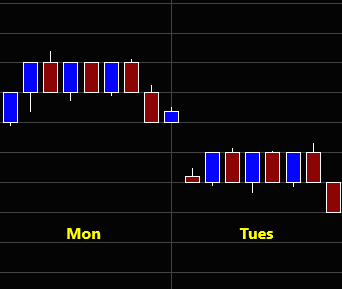
Standard Renko charts misalign between sessions making it impossible to exactly compare support and resistance across different trading sessions. Optimal Snap Bars solves this by generating renko bars that auto-snap to a fixed grid ensuirng optimal alignment from day to day.
This creates a perfectly-clear visual structure where you can instantly compare support and resistance levels, identify repeating patterns, and measure price action with precision.
03 Optimal Trendlines -trendlines that flex with the market
Still drawing static trendlines? We have a better way.
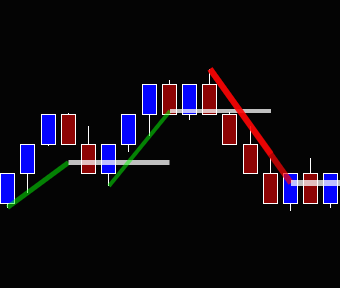
Optimal Trendlines dynamically adjusts its slope, position and width within a live trend based on trend-strength. This gives you tighter, more aggressive entry-points in strong moves and wider, more conservative levels when the market is softer.
And when a trendline breaks, trend-end markers flag exhaustion and convert into actionable support and resistance levels.
04 Optimal Entry -pullbacks that sharpen in strong trends
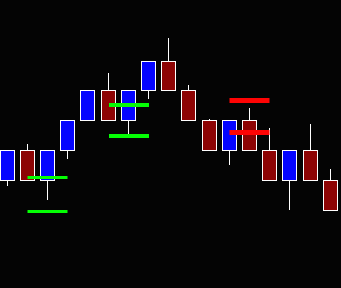
Optimal Entry calculates precise pullback levels within a trend to identify the zone where algos are likely to enter in the trend's direction.
These levels auto-adapt their width to the strength of the current move—so you can instantly see which zones carry the most weight and place your entry with confidence.
05 Optimal Patterns -classic price action patterns
Markets gravitate toward round numbers.
These psychological price points act as magnets for order flow, creating natural support and resistance that institutional traders watch closely.
Optimal Round Numbers automatically plots these critical levels on your chart, automatically switching color based on price action.
Instantly see when a round number flips from support to resistance.
06 Optimal Round Numbers -psychological levels that flip with price
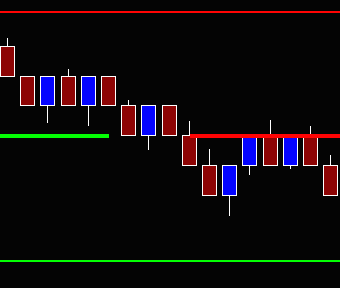
Markets gravitate toward round numbers.
These psychological price points act as magnets for order flow, creating natural support and resistance that institutional traders watch closely.
Optimal Round Numbers automatically plots these critical levels on your chart, automatically switching color based on price action.
Instantly see when a round number flips from support to resistance.
07 Optimal Session Zones -areas that map the session structure
Every trading session has a structure, and understanding it is critical to timing your trades.
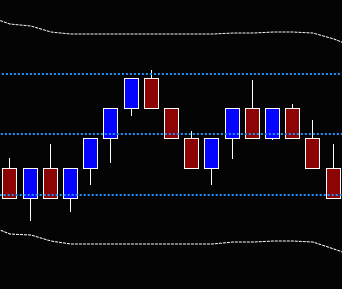
Optimal Session Zones combines three essential session-based tools into a single overlay: multiple Prior Sessions Highs and Lows define the battleground, Midpoint and Quarter Lines reveal internal structure, and Adaptive Bands highlight the boundaries of normal price behavior.
Together, they give you a complete map of where price has been—and where it's likely to go.
Imagine having an on-screen trading-mentor that advises you about the live market.
Optimal Market Assessment evaluates the current trading environment to determine if whether it is Favorable for discretionary traders (smoother trends, slower movement, levels respected) or Hostile (choppy, unpredictable, dominated by HFTs).
Based on this diagnosis, the on-screen meter suggests your strategic posture:
- Aggressive entries when conditions align
- Conservative entries when the market turns dangerous.
Adapt your trading strategy in real time: switch between aggressive and conservative modes as the market changes.
Optimal Snap Bars
Renko bars that snap to a fixed grid
Standard Renko charts misalign between sessions making it impossible to exactly compare support and resistance across different trading sessions. Optimal Snap Bars solves this by generating renko bars that auto-snap to a fixed grid ensuirng optimal alignment from day to day.
This creates a perfectly-clear visual structure where you can instantly compare support and resistance levels, identify repeating patterns, and measure price action with precision.
Optimal Trendlines
Trendlines that flex with the market
Still drawing static trendlines? We have a better way.
Optimal Trendlines dynamically adjusts its slope, position and width within a live trend based on trend-strength. This gives you tighter, more aggressive entry-points in strong moves and wider, more conservative levels when the market is softer.
And when a trendline breaks, trend-end markers flag exhaustion and convert into actionable support and resistance levels.
Optimal Entry
Pullbacks that sharpen in strong trends
Optimal Entry calculates precise pullback levels within a trend to identify the zone where algos are likely to enter in the trend's direction.
These levels auto-adapt their width to the strength of the current move—so you can instantly see which zones carry the most weight and place your entry with confidence.
Optimal Round Numbers
Psychological levels that flip with price
Markets gravitate toward round numbers.
These psychological price points act as magnets for order flow, creating natural support and resistance that institutional traders watch closely.
Optimal Round Numbers automatically plots these critical levels on your chart, automatically switching color based on price action.
Instantly see when a round number flips from support to resistance.
Optimal Patterns
Classic price-action patterns
Price action is the foundation of market structure.
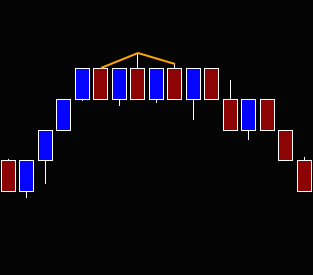
Optimal Patterns scans price action in real-time to identify the patterns the most reliable patterns -double tops, double bottoms, head and shoulders, and inverse head and shoulders.
No manual drawing. No clutter. Just classic patterns identified as they form.
Optimal System Levels
Areas that map the session structure
Every trading session has a structure and understanding it is critical to timing your trades.
Optimal System Levels combines dual time-frame price levels into a single overlay that defines the battleground, shows key algorithmic areas, and the boundaries of nomral price behaviour.
Together, they form a complete map of where price has been—and where it's likely to go.
- Optimal Market Assessment
- Optimal Snap Bars
- Optimal Trendlines
- Optimal Entry
- Optimal Patterns
- Optimal Round Numbers
- Optimal System Levels
- Optimal Trend-Finder -new!
01 Optimal Market Assessment -your on-screen trading mentor

Imagine having an on-screen trading-mentor that advises you about the live market.
Optimal Market Assessment evaluates the current trading environment to determine if whether it is Favorable for discretionary traders (smoother trends, slower movement, levels respected) or Hostile (choppy, unpredictable, dominated by HFTs).
Based on this diagnosis, the on-screen meter suggests your strategic posture:
- Aggressive entries when conditions align
- Conservative entries when the market turns dangerous.
Adapt your trading strategy in real time: switch between aggressive and conservative modes as the market changes.
02 Optimal Snap Bars -renko bars that lock to a fixed grid
Standard Renko charts misalign between sessions, making it impossible to exactly compare support and resistance across different trading sessions. Optimal Snap Bars solves this by generating Renko bars that auto-snap to a fixed grid, ensuring optimal alignment from day to day.
This creates a perfectly-clear visual structure where you can instantly compare support and resistance levels, identify repeating patterns, and measure price action with precision.
03 Optimal Trendlines -trendlines that flex with the market
Still drawing static trendlines? We have a better way.
Optimal Trendlines dynamically adjusts its slope, position and width within a live trend based on trend-strength. This gives you tighter, more aggressive entry-points in strong moves and wider, more conservative levels when the market is softer.
And when a trendline breaks, trend-end markers flag exhaustion and convert into actionable support and resistance levels.
04 Optimal Entry -pullbacks that sharpen in strong trends
Optimal Entry calculates precise pullback levels within a trend to identify the zone where algos are likely to enter in the trend's direction.
These levels auto-adapt their width to the strength of the current move—so you can instantly see which zones carry the most weight and place your entry with confidence.
05 Optimal Round Numbers -psychological levels that flip with price
Markets gravitate toward round numbers.
These psychological price points act as magnets for order flow, creating natural support and resistance that institutional traders watch closely.
Optimal Round Numbers automatically plots these critical levels on your chart, automatically switching color based on price action.
Instantly see when a round number flips from support to resistance.
06 Optimal Patterns -classic price action patterns
Price action is the foundation of market structure.
Optimal Patterns scans price action in real-time to identify the patterns the most reliable patterns -double tops, double bottoms, head and shoulders, and inverse head and shoulders.
No manual drawing. No clutter. Just classic patterns identified as they form.
07 Optimal System Levels -areas that map the session structure
Every trading session has a underlying structure, and understanding it is critical to timing your trades.
Optimal System Levels combines dual time-frame price levels into a single overlay that defines the battleground, shows key algothmic areas, and the boundaries of normal price behavior.
Together, they give you a complete map of where price has been—and where it's likely to go.
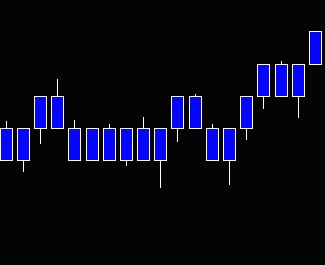
08 Optimal Trend-Finder -let the trend come to you
Stop squinting at charts—let the trend come to you. Optimal Trend-Finder paints every price bar in harmony with the underlying trend, instantly revealing whether you should look for longs, shorts or both.
No more second-guessing your read of price action; the trend is displayed on the bar, in real time, keeping you focused on execution, not interpretation.
Clearer signals, cleaner charts, faster decisions—see the trend, trade the trend.
Optimal Trend-Finder
Let the trend come to you
Stop squinting at charts -let the trend come to you. Optimal Trend Finder paints every price bar in harmony with the underlying trend, instantly revealing whether you should look for longs or shorts, or both.
No more second-guessing your read of price action; the trend is displayed on the bar in real time, keeping you focussed on execution, not interpretation.
Clearer signals, cleaner charts, faster decisions -see the trend, trade the trend.
Eight tools. One unified approach. End-of-day analysis to get you spotting trades quickly.
Optimal System brings it together.
Seven tools. One unified approach.
End-of-day analysis to get you spotting trades quickly.
The Optimal System brings it together.


Eight tools. One unified approach. End-of-day analysis to get you spotting trades quickly.
Optimal System brings it together.